

SA industry statistics
Growth in Wineries
| 2005 | 2006 | 2007 | 2008 | 2009 | 2010 | 2011 |
2012 |
2013 | |
| Number of primary wine producers | 4360 | 4183 | 3999 | 3839 | 3667 | 3596 | 3527 |
3440 |
3323 |
| Number of wine cellars which crush grapes | 581 | 572 | 560 | 585 | 604 | 573 | 582 |
582 |
564 |
| Producer cellars | 65 | 65 | 59 | 58 | 57 | 54 | 52 |
50 |
50 |
| Producing wholesalers | 21 | 17 | 20 | 23 | 23 | 26 | 25 |
23 |
21 |
Wine Produced (Million Gross Litres)
| 2005 | 2006 | 2007 | 2008 | 2009 | 2010 | 2011 |
2012 |
2013 | |
| Wine | 628.5 | 709.7 | 730.4 | 763.3 | 805.1 | 780.7 | 831.2 |
870.9 |
915.4 |
| Rebate | 82.9 | 82.1 | 101.5 | 86.6 | 71.4 | 39.6 | 34.2 |
62.3 |
42 |
| Juice | 64.6 | 73.2 | 65.2 | 72.5 | 34.7 | 51.2 | 40.2 |
40.1 |
58.7 |
| Distilling wine | 129.2 | 147.9 | 146.4 | 166.5 | 122.1 | 113.3 | 107.2 |
121.8 |
140.7 |
Total Hectares under Wine Grapes
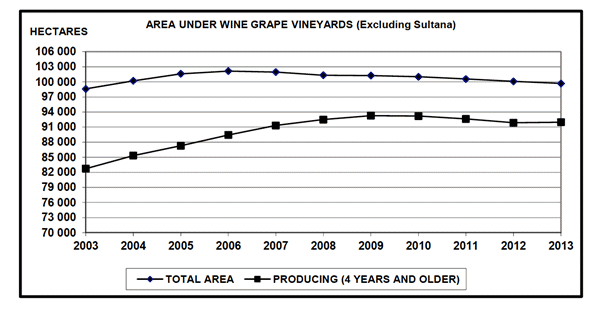
Total Hectares Planted and Uprooted
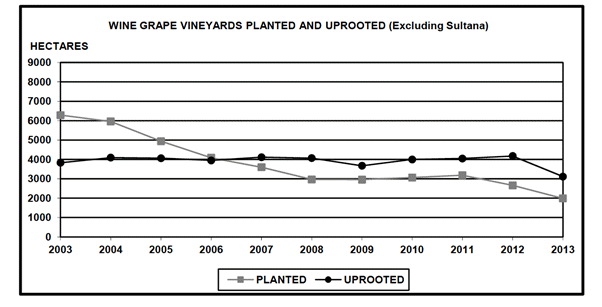
Wine Grapes as % of Total Hectares
| 1990 | 2000 | 2007 | 2008 | 2009 | 2010 | 2011 |
2012 |
2013 |
|
| % | % | % | % | % | % | % |
% |
% |
|
| Chenin | 32 | 24 | 19 | 19 | 18 | 18 | 18 |
18 |
18 |
| Chardonnay | 2 | 6 | 9 | 8 | 8 | 8 | 8 |
8 |
8 |
| Sauvignon Blanc | 4 | 6 | 8 | 9 | 9 | 10 | 10 |
10 |
9 |
| TOTAL WHITE | 84 | 64 | 56 | 56 | 56 | 56 | 56 |
55 |
55 |
|
|
|||||||||
| Cabernet | 4 | 9 | 13 | 13 | 12 | 12 | 12 |
12 |
12 |
| Merlot | 1 | 5 | 7 | 7 | 7 | 6 | 6 |
6 |
6 |
| Pinotage | 2 | 7 | 6 | 6 | 6 | 6 | 7 |
7 |
7 |
| Shiraz | 1 | 6 | 10 | 10 | 10 | 10 | 10 |
11 |
11 |
| TOTAL RED | 16 | 36 | 44 | 44 | 44 | 44 | 44 |
45 |
45 |
Age of Vines at 2013
|
Years |
White % |
Red % |
Total % |
|
<4 years |
4.0 |
3.7 |
7.7 |
|
4-10 years |
18.0 |
7.6 |
25.6 |
|
11-15 years |
7.4 |
21.5 |
28.8 |
|
16-20 years |
9.9 |
8.8 |
18.7 |
|
20+ years |
15.4 |
3.8 |
19.2 |
|
Total |
54.6 |
45.4 |
100 |
Total SA Exports
|
YEAR |
LITRES |
TREND |
|
1996 |
99 900 000 |
140 |
|
1998 |
116 800 000 |
108 |
|
2000 |
138 400 000 |
108 |
|
2001 |
176 100 000 |
126 |
|
2002 |
215 800 000 |
123 |
|
2003 |
237 300 000 |
110 |
|
2004 |
266 500 000 |
112 |
|
2005 |
280 084 000 |
105 |
|
2006 |
271 778 000 |
97 |
|
2007 |
313 886 000 |
115 |
|
2008 |
407 320 000 |
132 |
|
2009 |
389 141 000 |
96 |
|
2010 |
389 324 000 |
96 |
|
2011 |
350 564 774 |
95 |
|
2012 |
408 969 047 |
117 |
|
2013 |
517 406 010 |
126 |
% Total Exports by Country (Litres) (Bulk plus Bottled)
|
|
2010 |
2011 |
2012 |
2013 |
|
|
% |
% |
% |
% |
|
UK |
28 |
23 |
22 |
21 |
|
GERMANY |
19 |
23 |
19 |
18 |
|
NETHERLANDS |
7 |
7 |
6 |
4 |
|
SWEDEN |
10 |
10 |
8 |
6 |
|
AFRICA |
4 |
5 |
3 |
4 |
|
DENMARK |
5 |
5 |
4 |
4 |
|
CANADA |
4 |
4 |
5 |
4 |
|
USA |
4 |
4 |
6 |
6 |
|
BELGIUM |
3 |
3 |
2 |
2 |
|
RUSSIA |
5 |
2 |
8 |
7 |
|
ALL OTHER |
11 |
14 |
17 |
23 |
*Note: These figures do not take into account bulk wine bottled in one country (such as Germany or France) and then sold in another country.
Packaged Exports by Country (Litres)
|
PACKAGED |
2003% |
2009% |
2010% |
2011% |
2012% |
2013% |
|
UK |
50 |
40 |
30 |
22 |
17 |
22 |
|
NETHERLANDS |
19 |
9 |
9 |
10 |
10 |
8 |
|
SWEDEN |
7 |
14 |
14 |
15 |
14 |
12 |
|
GERMANY |
7 |
6 |
8 |
9 |
10 |
10 |
|
DENMARK |
2 |
5 |
5 |
4 |
4 |
4 |
|
CANADA |
2 |
4 |
4 |
4 |
5 |
4 |
|
BELGIUM |
2 |
2 |
2 |
3 |
3 |
3 |
|
USA |
3 |
4 |
4 |
5 |
6 |
6 |
|
FINLAND |
2 |
2 |
2 |
3 |
3 |
2 |
|
AFRICA |
|
2 |
4 |
6 |
8 |
12 |
|
CHINA |
|
|
|
2 |
3 |
2 |
|
ALL OTHERS |
8 |
12 |
18 |
17 |
17 |
15 |
Source:SAWIS
Total Packaged Wine (Litres) Export Growth Trends
|
|
2009/2008 |
2010/2009 |
2011/2010 |
2012/2011 |
2013/2012 |
|
UK |
111 |
70 |
59 |
76 |
131 |
|
NETHERLANDS |
99 |
97 |
91 |
85 |
100 |
|
SWEDEN |
118 |
98 |
82 |
84 |
96 |
|
GERMANY |
99 |
113 |
96 |
96 |
117 |
|
CHINA |
150 |
176 |
175 |
119 |
79 |
|
CANADA |
111 |
103 |
85 |
106 |
97 |
|
BELGIUM |
95 |
113 |
95 |
93 |
111 |
|
USA |
100 |
117 |
91 |
103 |
108 |
|
DENMARK |
95 |
102 |
63 |
85 |
121 |
|
TOTAL |
107 |
93 |
80 |
90 |
109 |
Source:SAWIS
")